TB-GWAS


Abstract

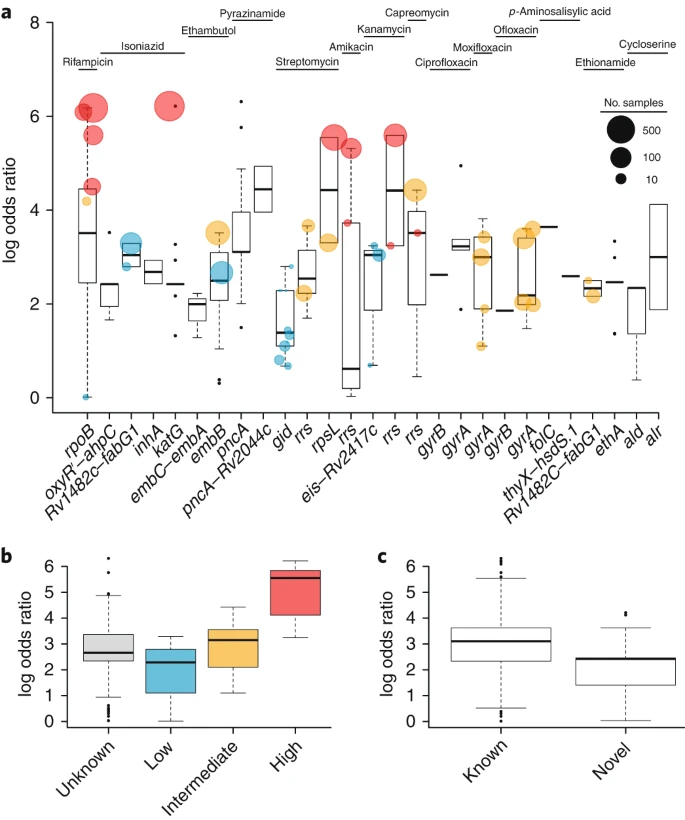
To characterize the genetic determinants of resistance to antituberculosis drugs, we performed a genome-wide association study (GWAS) of 6,465 Mycobacterium tuberculosis clinical isolates from more than 30 countries. A GWAS approach within a mixed-regression framework was followed by a phylogenetics-based test for independent mutations. In addition to mutations in established and recently described resistance-associated genes, novel mutations were discovered for resistance to cycloserine, ethionamide and para-aminosalicylic acid. The capacity to detect mutations associated with resistance to ethionamide, pyrazinamide, capreomycin, cycloserine and para-aminosalicylic acid was enhanced by inclusion of insertions and deletions. Odds ratios for mutations within candidate genes were found to reflect levels of resistance. New epistatic relationships between candidate drug-resistance-associated genes were identified. Findings also suggest the involvement of efflux pumps (drrA and Rv2688c) in the emergence of resistance. This study will inform the design of new diagnostic tests and expedite the investigation of resistance and compensatory epistatic mechanisms.

Figures

a) For each drug, box plots for the log odds ratios (P < 1 × 10−5) for each gene are arranged by increasing median value (as represented by the horizontal line in each box) to show relative effects on resistance. Mutations known to confer low, intermediate or high levels of resistance (Methods) are represented by points colored blue, yellow and red, respectively, and point size is proportional to mutation frequency. b, The distribution of log odds ratios (P < 1 × 10−5) for mutations within unknown (n = 167) or known loci conferring low (blue), intermediate(yellow) or high (red) levels of resistance. c, The distribution of log odds ratios for known and novel drug-resistance-conferring mutations (P < 1 × 10−5). All box plots consist of boxes (median and interquartile range) and whiskers that extend to the most extreme data points that were no more than 1.5 times the interquartile range from the box.

Citation

Coll F, Phelan J, …, Clark TG. Genome-wide analysis of multi- and extensively drug-resistant Mycobacterium tuberculosis. Nat. Genetics 2018; 50: 307–316.