Lineages
How it works
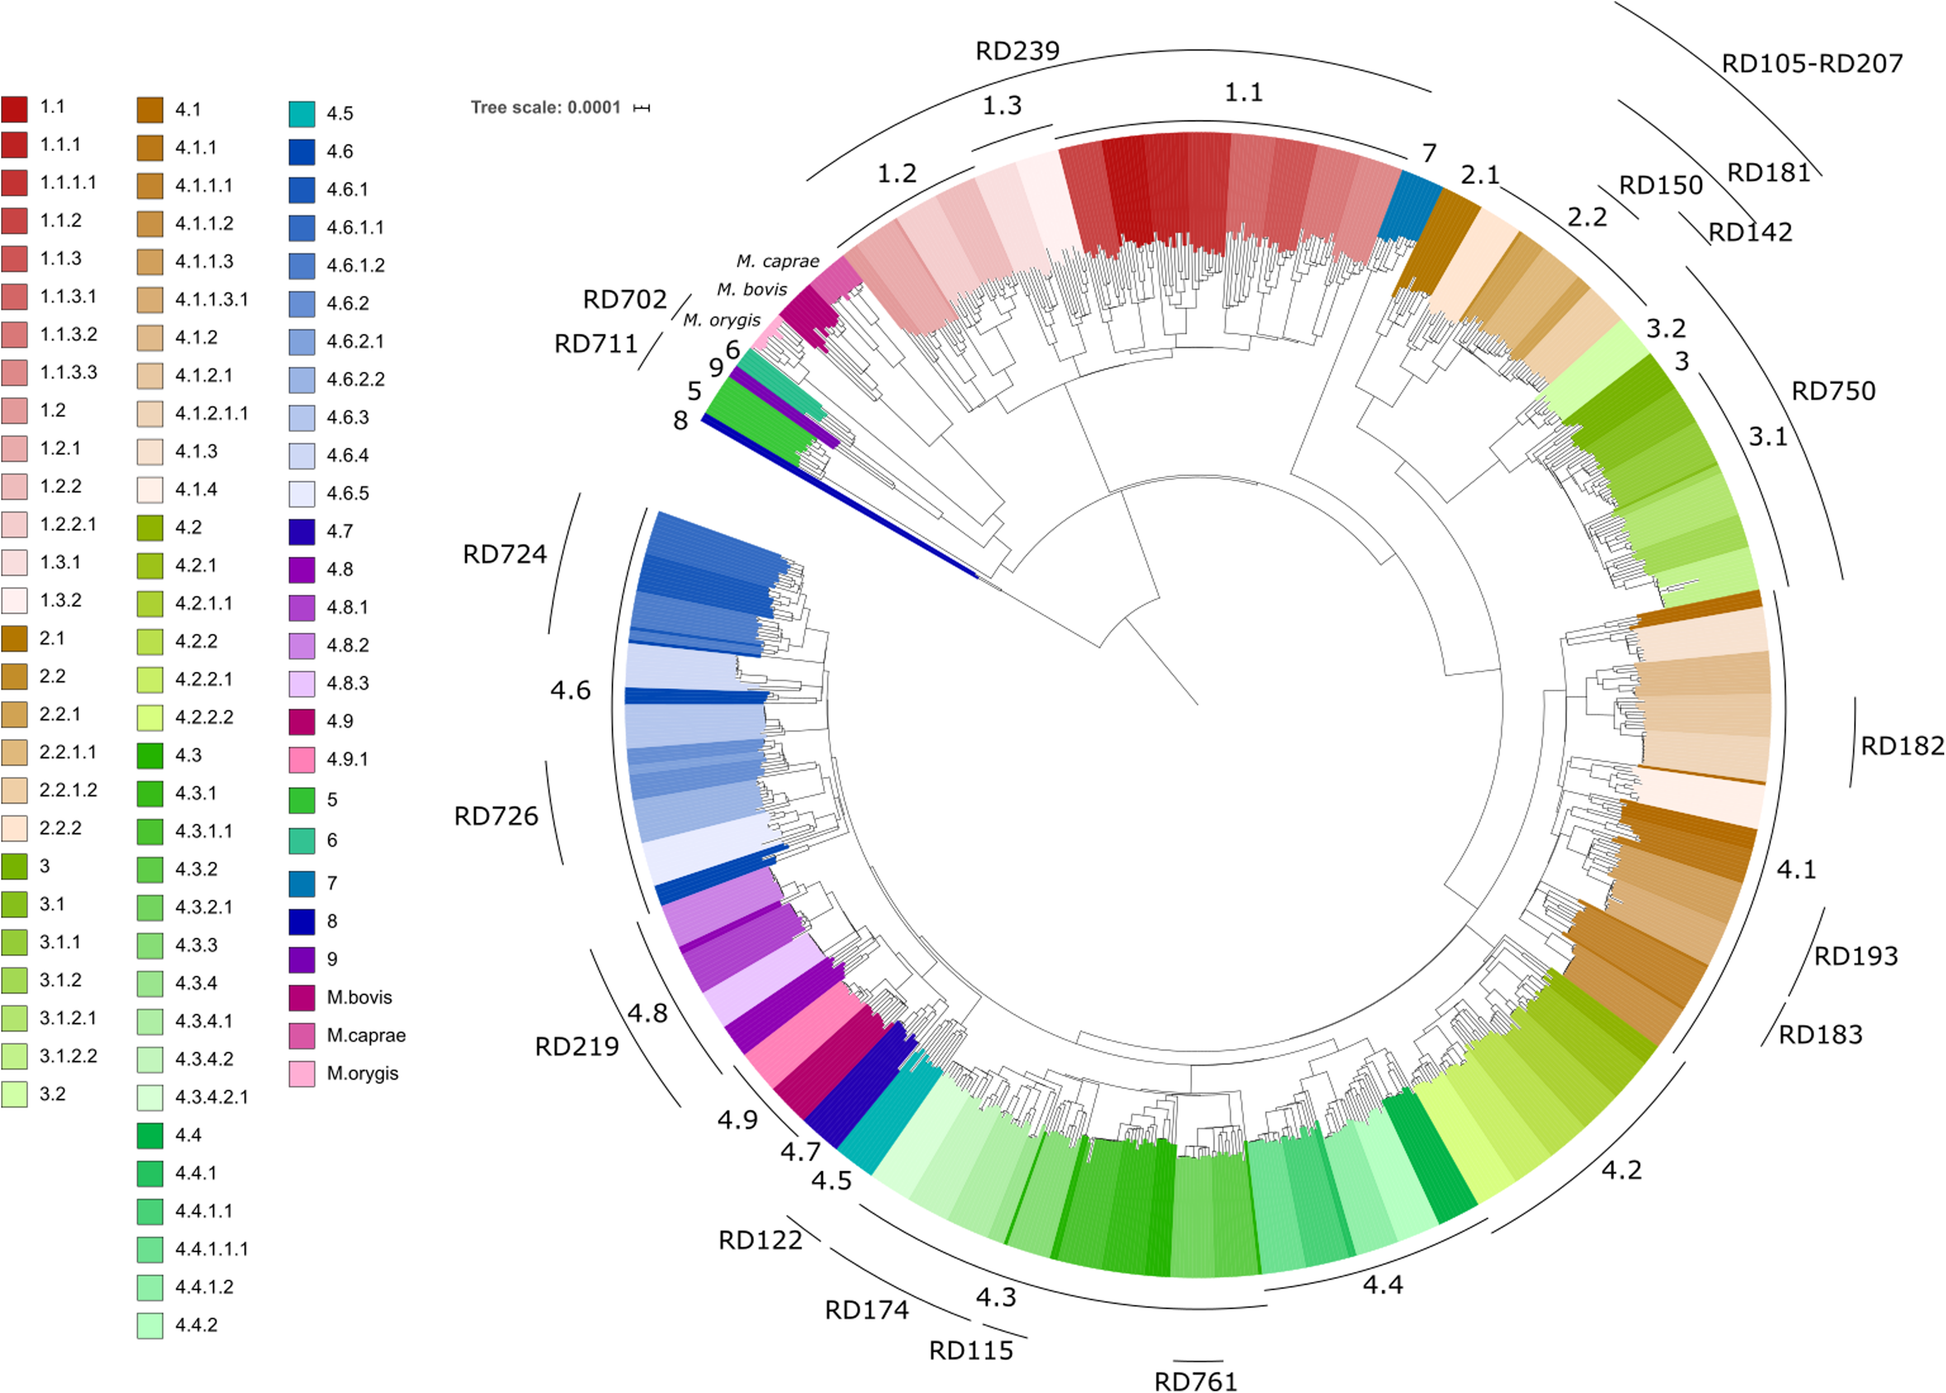
Lineages are assigned by looking for lineage-specific SNPs. The initial list of SNPs was published by Coll et al.. The SNP barcode was further refined by Napier et al. and Zwyer et al.
For each SNP in the barcode the proportion of lineage specific alleles are found. As each lineage has multiple SNPs, an average proportion is calculated and reported in the "lineage" field of the output. The lineage system is a hirearchical system where higher resolution is indicated by increasing number of digits (e.g. lineage 2.2.1).
Multiple lineages found
Sometimes tb-profiler may report the presence of multiple lineages (lineage1.2.1;lineage2.2.1). This could be due to:
- A mixed-strain infection
- Possible contamination
- Issues with low coverage
Check to see that get a consistant proportion for the sublineages within a major lineage as this will add confidence in the result.
Lineage calling algorithm
If we have a barcode with just lineage3 and lineage4 SNPs, then here is a hypothetical example of the internal data structure created by tb-profiler to represent the lineage information for a sample that is lineage3. I've added some noise to the data to show how the filtering works.
| id | chrom | pos | target_allele_count | other_allele_count | target_allele_percent | all_allele_count |
|---|---|---|---|---|---|---|
| lineage3 | Chromosome | 12204 | 143 | 0 | 100 | 153 |
| lineage3 | Chromosome | 69984 | 153 | 2 | 98.73418 | 158 |
| lineage3 | Chromosome | 342873 | 171 | 0 | 100 | 176 |
| lineage3 | Chromosome | 652950 | 153 | 0 | 100 | 167 |
| lineage3 | Chromosome | 1450316 | 125 | 0 | 100 | 136 |
| lineage3 | Chromosome | 1764225 | 130 | 1 | 99.27536 | 138 |
| lineage3 | Chromosome | 1925136 | 115 | 0 | 100 | 120 |
| lineage3 | Chromosome | 2738221 | 139 | 0 | 100 | 147 |
| lineage3 | Chromosome | 2782498 | 129 | 0 | 100 | 132 |
| lineage3 | Chromosome | 4396495 | 95 | 0 | 100 | 101 |
| lineage4 | Chromosome | 206481 | 0 | 86 | 0 | 100 |
| lineage4 | Chromosome | 498531 | 1 | 156 | 0.59524 | 168 |
| lineage4 | Chromosome | 546357 | 0 | 145 | 0 | 155 |
| lineage4 | Chromosome | 599868 | 2 | 125 | 1.53846 | 130 |
| lineage4 | Chromosome | 662911 | 0 | 163 | 0 | 178 |
| lineage4 | Chromosome | 931123 | 1 | 150 | 0.66225 | 151 |
| lineage4 | Chromosome | 1250340 | 0 | 142 | 0 | 148 |
| lineage4 | Chromosome | 2825466 | 0 | 145 | 0 | 151 |
| lineage4 | Chromosome | 2994187 | 0 | 115 | 0 | 123 |
| lineage4 | Chromosome | 3830695 | 0 | 151 | 0 | 161 |
The table above shows the proportion of lineage specific alleles for each SNP in the barcode. Several filtering steps are taken to only report high confidence lineage calls. Lineages are only reported if:
- They have at least 1 SNP with 2% or more of the reads supporting the lineage allele and at least 5 reads in total
- The interquartile range of the proportion of lineage specific alleles is less than 15
- The median proportion of lineage specific alleles is greater than 2%
Here is the specific code that is used to filter the lineages where df_all is the dataframe containing the lineage specific SNPs:
barcode_frac = {}
for taxon in df_all.id.unique():
    df = df_all[df_all.id==taxon].copy()
    pre_filt_num_sites = df.shape[0]

    fdf = df.copy() # filtered df

    num_good_sites = df[
        (df['target_allele_percent'] >= 2)
        & (df['all_allele_count'] >= 5)

    ].shape[0]

    # skip if no sites pass basic filters
    if num_good_sites==0:
        logging.debug(f'Skipping {taxon} as no sites pass basic filters')
        continue

    # skip if IQR > 15
    iqr = df['target_allele_percent'].quantile(0.75) - df['target_allele_percent'].quantile(0.25)
    if iqr > 15:
        logging.debug(f'Skipping {taxon} due to high IQR ({iqr})')
        continue

    # skip if median frequency < 2%
    median_frac = df['target_allele_percent'].median()
    if median_frac < 2:
        logging.debug(f'Skipping {taxon} due to low median frequency ({median_frac})')
        continue
    barcode_frac[taxon] = df['target_allele_percent'].median()
    logging.debug(f'Keeping {taxon} with median frequency {median_frac}')
In the example above lineage3 would be reported as it has a median frequency of 100% and lineage4 would be filtered out as (1) it doesn't have any SNPs passing the basic filters and (2) the median frequency is 0%.